Test-Retest Reliability Obtained During Repeat Diagnosis Using Questionnaires With Other Diagnostic Questions
TEST-RETEST RELIABILITY OBTAINED DURING REPEAT DIAGNOSIS USING QUESTIONNAIRES WITH OTHER DIAGNOSTIC QUESTIONS (test-retests using questionnaires 250, 584-B and 584-C, used in the project studying the statistics of intertype relations)
“A total of 178 test-retest pairs obtained from 125 different respondents were examined (if one respondent completed three questionnaires rather than two, that respondent was counted not in one but in three test-retest pairs). No selection and no rejection of retest pairs were carried out - the sample was formed “as is,” and whenever two completed questionnaires were available from any participant, the corresponding pair of resulting type profiles was included in the sample.
In the group of men (68 retest pairs of type profiles), the mean agreement of diagnosed types with claimed types (types based on self-typing) was 0,675; the mean agreement of the leading peaks in pairs of type profiles obtained using different questionnaires was 0,735; the median correlation between the type profiles in a pair was 0,942 (accordingly, the median overlap of the variances of the type profiles in a pair, equal to the square of their correlation, was 0,887). The mean overlap of the variances of the type profiles in a pair was 0,794.
In the group of women (110 retest pairs of type profiles), the mean agreement of diagnosed types with claimed types (types based on self-typing) was 0,484; the mean agreement of the leading peaks in pairs of type profiles obtained using different questionnaires was 0,564; the median correlation between the type profiles in a pair was 0,930 (accordingly, the median overlap of the variances of the type profiles in a pair, equal to the square of their correlation, was 0,865). The mean overlap of the variances of the type profiles in a pair was 0,782.
In the subgroup of men, the mean index of claimed socionics competence was 2,71, and the mean percentage of confidence in their claimed type was 76,4%.
In the subgroup of women, the mean index of claimed socionics competence was 2,45, and the mean percentage of confidence in their claimed type was 66%.
Thus, the higher accuracy characteristics in the subgroup of men are most likely explained not by their sex, but by the higher mean level of socionics competence in this subgroup (the point is that men as a whole are less interested in socionics, and whereas many women complete the tests repeatedly merely in order to determine their sociotype more accurately – being motivated by the desire to arrange their family life optimally, most men who complete the tests repeatedly are guided only by research interest, which in this subset of men is in turn correlated with deeper knowledge of socionics, higher intelligence, and a deeper level of self-reflection).
In the sample not divided by sex (178 retest pairs of type profiles), the mean agreement of diagnosed types with claimed types (types based on self-typing) was 0,559; the mean agreement of the leading peaks in pairs of type profiles obtained using different questionnaires was 0,629; the median correlation between the type profiles in a pair was 0,935 (accordingly, the median overlap of the variances of the type profiles in a pair, equal to the square of their correlation, was 0,874). The mean overlap of the variances of the type profiles in a pair was 0,787.
The sample of people with retest pairs of profiles corresponds, in all its parameters, to the sample of people on which we study intertype relations (mean index of socionics competence, confidence in one’s type, mean height of the raw type profile according to the questionnaire, mean indicator f characterizing the “purity” of the type).
Therefore, all of the results obtained, including the mean agreement with self-typing, the mean retest agreement of the leading profile peaks, and the mean overlap of the variance of a person’s type profiles in their retest pairs, can also be applied to the sample on which intertype relations are studied using the same questionnaires.
In the intertype-relations research project, the conclusions that can also be drawn from these numbers about the accuracy of determining intertype relations are important to us. When intertype relations are determined from the leading peaks of the type profiles of two people, the probability of correctly classifying the intertype relation is obviously the same 0,629 (63%), while the probability of error is 37%. If, however, intertype relations are diagnosed from the pair of type profiles as a whole (and not only from their leading peaks), then the probability of correctly determining the intertype relation in a pair of people is equal to the mean reliability of reproducing the variance of the type profile, that is, 0,787 (79%), with the probability of error in determining the intertype relation averaging 21%.
And, irrespective of any scientific research projects, all questionnaire respondents should be interested in the accuracy (reliability) with which the questionnaires determine their sociotype on average. The type profile as a whole is determined with a median reliability value of 0,935 (this is very high). The leading peak of the profile is determined with an average reliability of 79% (but this is only the sample-average value; the probability of determining it reliably depends very strongly on whether the person’s type is relatively pure, strictly close to one of the “standard” sociotypes – in this case, the mean probability of accurately determining this type approaches 90%, and conversely, if a person’s type is strictly intermediate between two classical sociotypes, then the probability of correctly identifying the single standard type to which the person is only very slightly closer than to the other falls practically to the level of 50%).
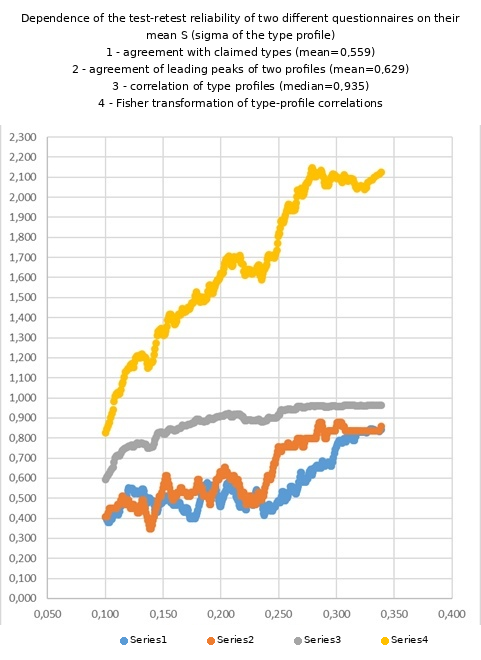
Overall, the reliability of type diagnosis depends on two parameters. The first is the height of the person’s “raw” type profile diagnosed by the questionnaire. Profile height is the standard deviation (that is, the root-mean-square spread from a mean value of zero) of the 16 algebraic numbers that form the respondent’s type profile diagnosed by the questionnaire. This parameter, characterizing the height or contrast of the profile, is denoted by the letter S. The larger S is, the better it is for the reliability of the results. S is higher if, first, the person’s answers to the diagnostic questions were thoughtful and careful, and also if the person has sufficient life experience to objectively evaluate their behavior and life preferences, as well as to compare themselves with other people. Second, S also depends on the objective level of the person’s personality accentuation, that is, on the degree to which their psychological functions actually deviate from the population mean. There objectively exist people in whom all functions are “somewhere in the middle,” neither low nor high, but so-so. It is clear that both the type and functional profiles of such people are weakly expressed, with low contrast. In this case, little depends either on the care with which the questionnaire is completed or even on life experience, and the questionnaire is not lying when it repeatedly shows a low profile height for them.
Nevertheless, in any case, both the retest reproducibility of the profile shape (it is measured by the correlation between the first test type profile and the second retest type profile) and the reliability of identifying the single standard sociotype that is closest in properties to the given person depend on the value of S. Thus, in the group of respondents with a lower S value (from 0,05 to the sample mean of 0,22), the median correlation in this group between the test and retest type profiles is 0,876, while the reproducibility of the leading peak of the type profile is 0,506.
In the other half of the participants, with S values from the sample mean of 0,22 up to the maximum value in the sample of 0,41, the median test-retest correlation of the type profiles is already 0,963 (that is, a much higher value), while the mean test-retest reproducibility of the leading peak of the type profile rises to 0,753 (one and a half times higher than in the half of participants with low S). Accordingly, these subgroups of participants also differ in the reliability with which the leading peak of their type profile is determined (that is, the reliability of correctly determining the standard sociotype whose properties are closest to those of the given person). If, in the half of people with low S, the mean probability that the questionnaire correctly determines the single and most important leading peak is 71%, then in the half of people with high S this probability is already 86%.
However, the probability of correctly determining the single closest sociotype depends not only on your individual S (the height, contrast of your type profile).
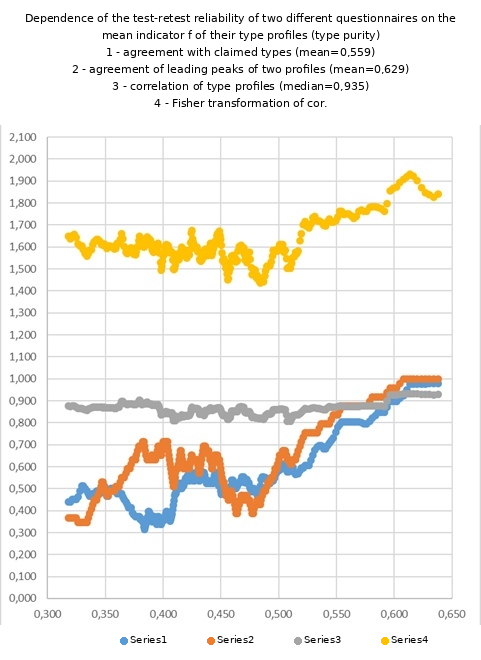
To an even greater extent, it depends on the “purity” of your type, that is, on how close you are to only one of the standard sociotypes (rather than, for example, being located by your properties exactly midway between two or even three standard sociotypes – which is also quite common). This indicator of the conditional “purity” of a type is measured using the so-called indicator f, which shows how much the leading peak of your profile differs in height from the second and third peaks of the same profile next in height.
Specifically, indicator f is calculated as follows: f=(h1-0,425*h2-0,353*h3)/h1
Here h1 is the height of the highest peak of the type profile, and h2 and h3- the second and third highest. The higher your indicator f, the conditionally “purer” your type is (precisely conditionally, - because the identified “standard” sociotypes are merely psychological conventions, and points at intermediate coordinates between them are, by God, absolutely no worse in their properties than points at the centers of the so-called standard sociotypes). If, however, by your psychological properties you are intermediate between two or even three sociotypes, then your indicator f will be low. The median value of f in our sample is 0,442. Accordingly, the half of people whose f is above 0,442 have a comparatively pure “single” sociotype, whereas the half of people with f below 0,442 belong rather to intermediate psychotypes.
It is important to emphasize that indicator f is in no way related to the indicator S considered above; they are independent of each other.
The test-retest correlation of type profiles does not depend on the value of indicator f, but the reproducibility of determining a single leading peak in the profile depends on it very strongly, and therefore the probability of correctly identifying the leading peak in your type profile also depends strongly on f. And it is clear why – if your f is very low, then two or even three peaks in your type profile are practically equal in height and simultaneously contend for first place, and the probability of making an error in identifying a single “leader” among them immediately rises sharply.
Measurement shows that, in the half of people in our sample with comparatively low f (from 0,277 to 0,442), the test-retest reproducibility of the leading profile peak is on average only 0,561 (hence the mean probability of reliably identifying the leading peak is 74%). At the same time, in the half of people with high f, from 0,442 up to 0,747 (and any S), the test-retest reproducibility of identifying the leading profile peak rises to 0,697, while the mean probability that the questionnaire correctly identifies the leading peak becomes 83%. And this is – without taking into account differences among participants in indicator S, that is, the contrast of their type profile.
If both indicators are taken into account, the differences between people in the possibility of unambiguously determining their single sociotype become even more sharply expressed. Thus, in the subset of participants in which both S and f are simultaneously above the mean level, the test-retest reproducibility of identifying the leading type in the profile reaches 0,833, while the corresponding mean probability of correctly identifying a single leading sociotype becomes 91%.
Why 91%, and not 100%? Because there is also such a thing as objective variations in a person’s mental state. Incidentally, in different people these variations, owing to differences in their emotional reactivity, can have substantially different ranges. And people with a large range of these variations may show one type on the questionnaire in one state, while in another state, answering just as sincerely (and even not on a different questionnaire but on the very same questionnaire), they may quite honestly show another type – one that may differ from the first in its pole on any of the basic Jungian dichotomies, or even two of them at once.
Despite all these qualifications and limitations, determining a person’s sociotype by means of questionnaires nevertheless remains the method with the highest reliability. It is multiple times more accurate than any expert diagnosis (even one conducted over a long period of time by a highly qualified specialist), and considerably exceeds even participants’ self-typing in accuracy. In addition, only questionnaires make it possible to determine not only the standard sociotype closest in properties, but also the person’s complete, precise coordinate in psychological space, that is, all the additional nuances of their type, trait, and functional profiles.
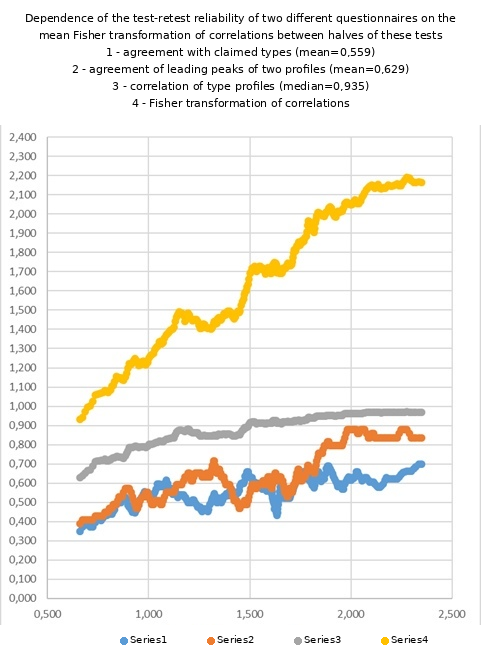
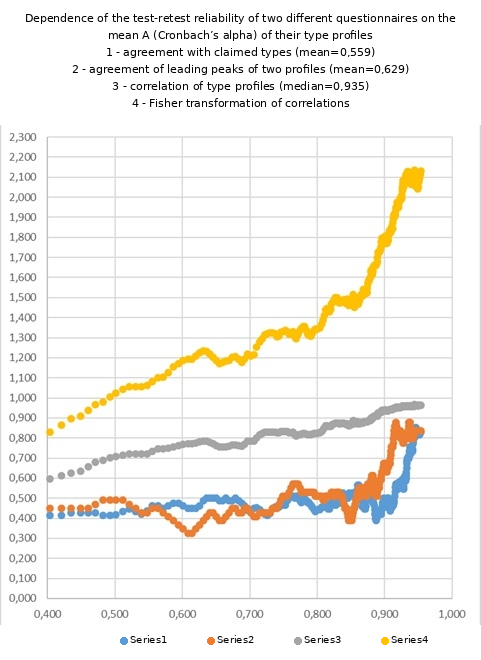
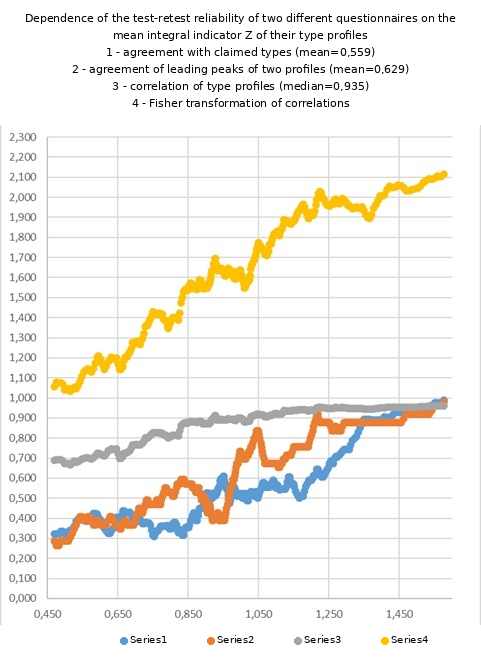
The figures attached to the post show empirical graphs of the dependence of the main retest indicators of questionnaire reliability on a number of respondent-specific characteristics of the respondent’s type profile.
In addition to the indicators S and f, which individually characterize each person’s type profile, the figures also include K – the correlation between type profiles obtained by splitting one questionnaire into two halves. They also include two derived indicators. One of them, indicator A, is the Cronbach’s alpha indicator widely used in psychology, in this case characterizing the reliability of the shape of the resulting type profile. It directly depends on profile height S:
A= (S^2-0,0051)/ (S^2)
The other indicator, Z, is jointly derived from A and f: Z= A^6+2,2*f-0,45
Indicator Z most fully characterizes the joint influence of S, A, and f on the questionnaire’s ability to correctly identify in the resulting type profile a single type peak whose properties are closest to those of the respondent.
The Fisher transformation mentioned in the graphs – is applied to the values of linear correlation coefficients in order to make the distribution of the values of these coefficients Gaussian (Gaussian distributions are much more convenient to work with mathematically).
How were all the presented graphs constructed? All test-retest pairs in the sample were arranged in ascending order according to the value of the indicator plotted on the abscissa. The indicators plotted on the vertical Y axis were then averaged over 25 test-retest pairs with closely adjacent values on the X axis. Thus, all points on the graphs are averages over 25 experimental points that were adjacent on the X axis.”
Intercorrelations of Various Reliability Indicators
| S | Fisher(K) | A | f | Z | Agreement with claimed type | Test-retest agreement of leading peaks | Correlation of test and retest type profiles | Fisher transformation of the preceding correlation | |
|---|---|---|---|---|---|---|---|---|---|
| S (standard deviation of the values of the raw type profile) | 1,00 | 0,36 | 0,21 | 0,29 | 0,30 | 0,25 | 0,21 | 0,44 | 0,48 |
| Fisher(K), where K is the correlation of profiles obtained by splitting the questionnaire into two equal halves | 0,36 | 1,00 | 0,38 | 0,43 | 0,34 | 0,29 | 0,28 | 0,32 | 0,44 |
| A= (S^2-0,0051)/ (S^2) | 0,21 | 0,38 | 1,00 | 0,85 | 0,56 | 0,58 | 0,73 | 0,07 | 0,46 |
| f=(h1-0,425*h2-0,353*h3)/h1 | 0,29 | 0,43 | 0,85 | 1,00 | 0,70 | 0,68 | 0,70 | 0,12 | 0,58 |
| Z= A^6+2,2*f-0,45 | 0,30 | 0,34 | 0,56 | 0,70 | 1,00 | 0,87 | 0,80 | 0,14 | 0,78 |
| Agreement of the leading type diagnosed by the questionnaire with that claimed by self-typing | 0,25 | 0,29 | 0,58 | 0,68 | 0,87 | 1,00 | 0,76 | 0,20 | 0,74 |
| Test-retest agreement of the leading type in the profile | 0,21 | 0,28 | 0,73 | 0,70 | 0,80 | 0,76 | 1,00 | 0,07 | 0,64 |
| Correlation between the 16 values of the test and retest type profiles | 0,44 | 0,32 | 0,07 | 0,12 | 0,14 | 0,20 | 0,07 | 1,00 | 0,71 |
| Fisher transformation of the correlation between the 16 values of the test and retest type profiles | 0,48 | 0,44 | 0,46 | 0,58 | 0,78 | 0,74 | 0,64 | 0,71 | 1,00 |